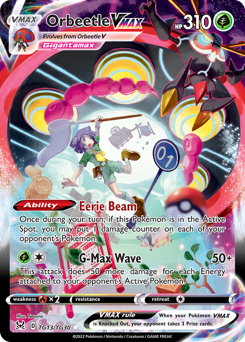
Orbeetle VMAX #TG13 Lost Origin Trainer Gallery Holofoil Price
Lost Origin Trainer Gallery · #TG13 · Holofoil
Orbeetle VMAX Holofoil (Lost Origin Trainer Gallery #TG13) is worth $10.24 raw as of November 15, 2026, down 11.5% over the last 30 days, with a PSA 10 around $69.99.
Scroll over the card to resize · click to enlarge ✦
$10.24latest TCGplayer median
Buy or sell
Links to third-party marketplaces. ChasingFoil may earn a commission. Prices and availability set by sellers.
Price history (TCGplayer median, ~180 days)
Orbeetle VMAX #TG13 price, trend & prediction
Orbeetle VMAX #TG13 (Holofoil, Rare Holo VMAX) from Lost Origin Trainer Gallery (2022) has a market price of $10.24 raw as of November 15, 2026, the TCGplayer market price for this exact printing. For context, the median Lost Origin Trainer Gallery card is $8.16; this one ranks #13 of 30 priced printings. Over the last 30 days the price has fallen (−11.5%), −3.7% in the last week, −16.1% over 90 days. Its 180-day range is $10.23 to $12.62 — it is trading near the bottom of that range.
Graded copies of Orbeetle VMAX sell for more than raw. A PSA 10 has a recent sale median of $69.99, about 6.8× the raw price (88 recent sales). PSA 9 copies go for around $18.30, about 1.8× the raw price (18 recent sales). Other grades we track: BGS 10 at $164.99, TAG 10 at $70.00, ACE 10 at $62.87. Graded medians come from recent eBay sold listings and refresh daily.
Orbeetle VMAX #TG13 price prediction: if recent momentum continues, the 30-day trend for this card is downward. Momentum is pointing down: the price is lower across the windows we track (−11.5% over 30 days, −3.7% over 7 days, −16.1% over 90 days). This is a read of past price moves, not a model forecast and not investment advice — see the forecast methodology and public accuracy scoreboard for how our ML outlooks are built and scored.
Related cards
Other Orbeetle cards by value
Similar value in Lost Origin Trainer Gallery
- Gallade V #TG19$9.74
- Enamorus V #TG18$11.68
- Crobat V #TG20$12.06
- Boss's Orders #TG24$8.16
- Eternatus VMAX #TG22$13.44